How MER Affects Long-Term Investment Growth: A 1% Fee Quietly Costs $113,556 on $100K Over 25 Years
The management expense ratio on your fund gets deducted before you ever see your returns. No invoice. No notification. No reminder. Over 25 years on a $100,000 portfolio, a 1% MER difference compounds to roughly $113,556 in lost growth. That is not fees you paid. It is portfolio value that was quietly subtracted every single year before it appeared on your statement. This article explains exactly how that happens, what it looks like across different time horizons, and how to use MER when evaluating funds.
Educational Disclaimer: This article describes a portfolio structure used in Canadian index investing for educational purposes only. It does not constitute financial, investment, or tax advice. ETF examples are illustrative only and are not investment recommendations. Comparable products from other providers may exist. Consult a registered financial advisor before making any investment decisions.
Introduction
Why MER affects long-term investment growth more than you think? Most people think investing is about picking winners. But before returns even start working for you, fees quietly take money out, every single year. That fee is called the Management Expense Ratio (MER). Even when markets perform well, MER reduces your returns in the background. And over decades, small fees can create large differences in outcomes. In this guide, you’ll learn:
- What MER really means (in plain language)
- How investment fees reduce returns over time
- How the compounding effect of fee differences scales across 10, 20, and 30-year horizons
Looking for a deep dive guide? Visit our Technical Analysis of How MER Affects Long-Term Portfolio Growth article. To see how these fee savings look inside a real Canadian RRSP portfolio, see how I built a tax-efficient RRSP portfolio at 0.241% total cost. You can build, backtest and stress test your portfolio, check our Canadian ETF portfolio backtest guide.
What Is the Management Expense Ratio (MER)?
MER stands for Management Expense Ratio. It’s the annual percentage a fund charges to operate and manage your investment. Think of it like this: Your money pays a small toll every year just to stay invested. You never receive a bill. The fee is automatically deducted before you see your returns. That’s why MER is easy to ignore, but costly over time.
Key takeaway:
If two funds earn the same return before fees, the one with the lower MER always leaves you with more money.
How MER Affects the Long-Term Investment Growth?
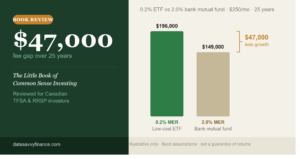
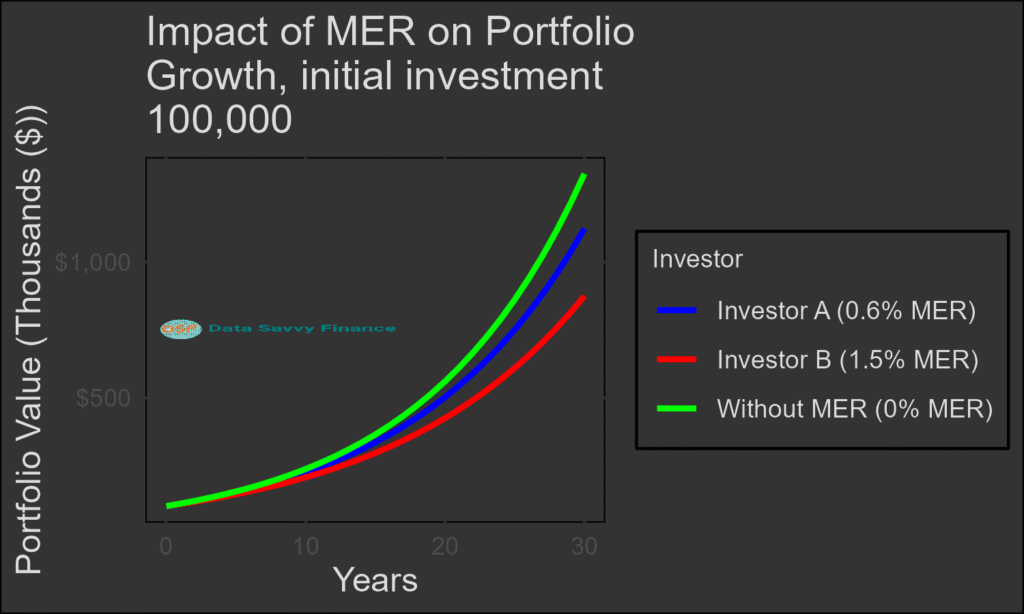
A common reaction is: “It’s only 0.5%. That’s nothing.” But investing is long-term, and fees compound against you. Every year fees reduce your balance. That smaller balance earns future returns. The gap keeps growing.
What the graph in Figure 2 shows, is that same starting investment, same market returns, but different MERs could produce very different outcomes
Rule of thumb:
Small fees don’t feel painful, but they quietly drain long-term growth.
What Does MER Pay For?
This is something that confused me for a while. I kept thinking the MER was some kind of service fee I was choosing to pay, like a subscription. It is not. It is deducted automatically from the fund’s assets before the daily price is calculated. You never see it as a line item.
The MER covers the actual operating costs of running the fund, including portfolio management, administration, regulatory compliance, trading costs, and distribution. For actively managed funds, it also includes the cost of the research team and the trading activity involved in trying to beat the market. For passive ETFs, there is no research team and far less trading, which is why their MERs tend to be lower.
A rough comparison: a broad Canadian equity ETF tracking the TSX Composite typically charges around 0.06% to 0.09% in MER. A comparable actively managed Canadian equity mutual fund commonly charges 1.5% to 2.5%. The difference in what is being paid for is substantial. The ETF’s fee covers maintaining the index and basic fund operations. The mutual fund’s fee covers a management team, marketing, distribution commissions to advisors, and fund infrastructure on top of the basic operations.
Here is the important part. Higher fees do not mean better returns. The research on active fund performance is consistent across decades and markets: the majority of actively managed funds underperform their benchmark index over 10-plus year periods, after fees. The MER is not compensated by extra return. It is simply deducted from whatever the market returns.
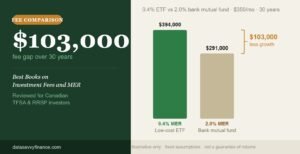
Lower fees do not guarantee better outcomes either, markets can decline regardless of what the fund charges. But higher fees guarantee one thing with certainty: a drag on returns in every single year, regardless of market direction. That drag compounds. Over 25 years on $100,000, the compounding effect of a 1% fee difference is approximately $113,556 in portfolio value. These figures are illustrative projections using fixed return assumptions. Actual results vary with market conditions.
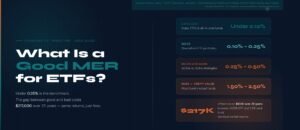
What Is a Good Expense Ratio for an ETF?
I spent more time on this question than I probably needed to. The short version: under 0.25% is a reasonable benchmark for most ETFs in Canada or the US. Under 0.10% is excellent. Above 0.50% needs a clear reason.
Here is a rough guide to what different MER levels actually look like in practice. Broad index ETFs tracking major markets like the S&P 500 or the entire Canadian stock market typically sit between 0.03% and 0.09%. Diversified all-in-one ETFs that bundle multiple asset classes into one fund usually run between 0.18% and 0.25%. Sector ETFs and thematic ETFs commonly range from 0.40% to 0.75%. Actively managed ETFs and most bank mutual funds sit between 1.0% and 2.5%.
The comparison that matters most for most investors is between an index ETF and an actively managed mutual fund covering similar markets. If both give you exposure to Canadian equities, the structural cost difference between 0.09% and 2.0% is 1.91 percentage points every year. That is not a rounding error over 25 years.
When comparing two funds with similar market exposure and similar holdings, the fee difference is one of the structural variables that can be evaluated before investing. How an investor weighs that alongside other factors depends on their own situation and goals, which this article cannot assess. For a deeper look at what different MER tiers look like and what the dollar impact is over time, see the full guide on what is a good MER for ETFs in Canada on DatasavvyFinance.com.
ETF examples mentioned throughout this article are provided for educational illustration only and are not investment recommendations. Comparable products from other providers may exist.(We’ll break this down further in a dedicated article.)
How to Use MER in Real Investment Decisions?
The practical application is simpler than most investing decisions. You do not need a spreadsheet or a financial advisor to use MER as part of how you evaluate a fund. The comparison is already on the fund provider’s website.
When looking at two funds that cover similar markets, the MER shows up on the fund’s fact sheet or on the provider’s website under “Fund Details” or “Management Fees.” Compare the MERs directly. If the underlying holdings and geographic exposure are similar, the fee difference is a structural variable that compounds every year in either direction.
I remember the first time I pulled up the fact sheet for the mutual fund I had in my RRSP. The MER was 2.1%. I then looked up a comparable all-in-one ETF covering similar markets. The MER was 0.20%. I had not thought about this before because the mutual fund never sent me a bill. The fee was just gone before I ever saw my return. That 1.9% difference was not going to produce any extra management, analysis, or insight that would compensate for it. It was just a structural cost.
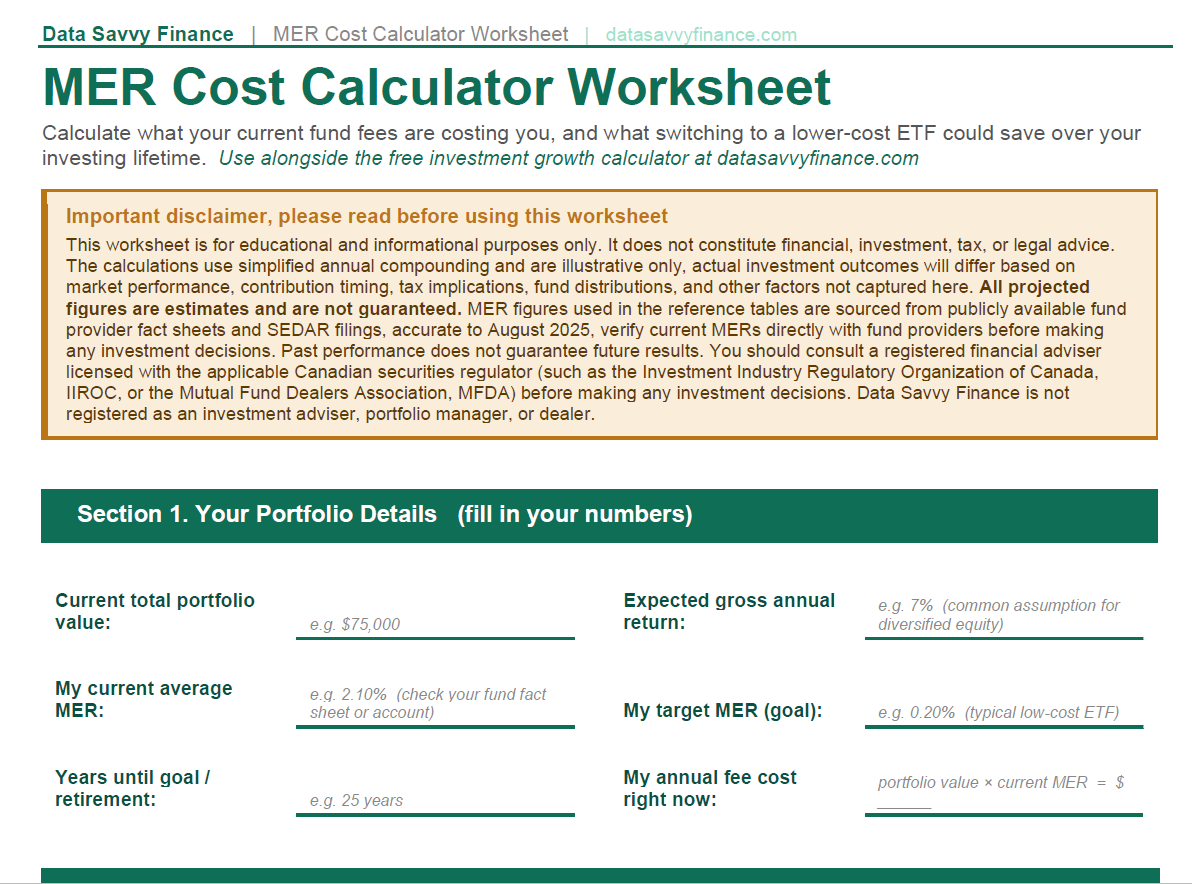
The way to use this practically is to start with your current fund holdings. Look up the MER on each. Compare it to a passively managed index fund or ETF covering the same market. Then use the investment growth calculator at DatasavvyFinance.com to model what that fee difference compounds to over your specific time horizon and starting balance.
Fees are one of the few structural variables in investing that are fully knowable before you invest. Returns are not. Market direction is not. But the MER is right there on the fund’s fact sheet, and it compounds in either direction every single year. Understanding what it means in dollar terms over your specific timeline is one of the more useful things you can do with twenty minutes and a calculator.
For a deeper look at how to calculate the full all-in cost of a portfolio including foreign withholding tax drag, see the low-cost RRSP ETF portfolio guide on DatasavvyFinance.com.
Frequently Asked Questions
MER stands for Management Expense Ratio. It is the annual percentage fee charged by a mutual fund or ETF to cover its operating costs, including portfolio management, administration, trading, and distribution. The MER is expressed as a percentage of the fund’s average net assets and is deducted from the fund’s returns before the daily price is published. Investors do not receive a bill or notification when MER is deducted. It reduces the net return automatically, which is why its compounding impact over long time horizons is often underestimated.
On a $100,000 starting investment with a 7% assumed gross annual return and no additional contributions, the difference between a 0.20% MER and a 1.20% MER compounds to approximately $113,556 in ending portfolio value over 25 years. The exact amount depends on starting balance, gross return assumption, contribution schedule, and time horizon. The investment growth calculator at DatasavvyFinance.com allows you to model this with your own numbers. These are illustrative projections using fixed return assumptions. Actual results vary with market conditions.
The management fee is one component of the MER. It covers the cost of portfolio management and investment oversight. The MER is the total annual fee, which includes the management fee plus additional operating costs such as administration, fund accounting, legal fees, and marketing or distribution expenses. For most ETFs the management fee and MER are close in value. For actively managed mutual funds the difference can be more significant. The MER is the number that matters for cost comparison because it represents the full annual drag on returns.
ETFs that track an index use a rules-based strategy, meaning the fund simply holds the securities in a particular index in proportion to their weights. This approach requires minimal active management, generates less trading activity, and does not involve a large research team making buy and sell decisions. Mutual funds that are actively managed pay for portfolio managers, analysts, and higher trading costs. The difference in operating cost is reflected in the MER. A broad Canadian equity ETF tracking the TSX Composite typically carries an MER around 0.06% to 0.09%. A comparable actively managed Canadian equity mutual fund commonly charges 1.5% to 2.5%.
The MER is published on the fund provider’s website under the fund’s details or fact sheet page. For Canadian ETFs, it is also disclosed in the fund’s Fund Facts document, which is a standardized document all Canadian funds are required to produce. Most major Canadian discount brokerages also display the MER on the fund detail page when you search by ticker. For mutual funds held at a bank, the MER appears in the simplified prospectus and in the Fund Facts document. If you are unsure which document to look in, searching the fund name and “MER” on the fund provider’s website typically returns the fact sheet directly.
No. A lower MER means a lower structural cost, which is a genuine advantage when comparing funds with similar market exposure and similar holdings. But MER is one factor among several. A fund covering a different market, using a different strategy, or serving a different purpose is not directly comparable to a low-cost index ETF just because the MER is higher. The relevant comparison is between funds covering the same or very similar markets. In those comparisons, the fee difference is a structural cost that compounds over time regardless of which direction the market moves. This article cannot assess which specific funds or fee levels are appropriate for any individual investor.
MER is an ongoing annual fee deducted from the fund’s assets, expressed as a percentage of the fund’s value. It applies every year you hold the fund regardless of whether you buy or sell. A trading commission is a one-time fee charged by your brokerage when you execute a buy or sell order for an ETF or stock. Many Canadian discount brokerages have eliminated commissions on ETF purchases. MER is charged by the fund itself and cannot be avoided by choice of brokerage. Trading commissions are charged by the brokerage and vary by platform and trade type.
A reasonable MER for a Canadian ETF is generally under 0.25%. Broad index ETFs tracking major markets such as the S&P/TSX Composite or the S&P 500 typically carry MERs between 0.03% and 0.09%. Diversified all-in-one ETFs bundling multiple asset classes typically range from 0.18% to 0.25%. MERs above 0.50% generally require a specific justification such as a niche strategy or a market with limited passive alternatives. For a full breakdown of MER tiers and the dollar impact of each level, see the guide on what is a good MER for ETFs in Canada on DatasavvyFinance.com. ETF examples are illustrative only and are not investment recommendations.